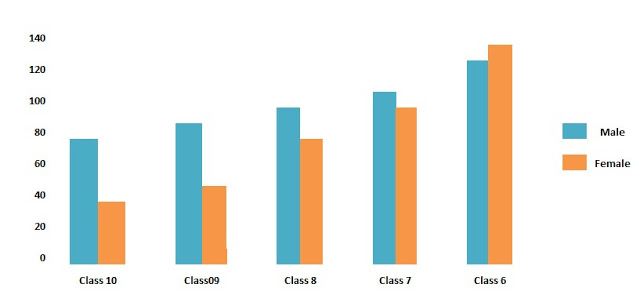
Ans: The graph shows the enrollment of students at school from class 6 to class 10. It shows the gradual increase of the enrollment of girls which is undoubtedly a positive change because total development of the country is not possible keeping the women aloof from education. In class 10 boys and girls students are 75 and 35 respectively which mean boys are more than double of the girls. In class 9 the scenario is almost the same. In class 9 the number of boys and girls are 80 and 40 respectively. The number of girls in class 8. In this class the number is 90 respectively. But we see a different scenario in classes six and seven. In class 7 the number of boys and girls is almost the same. The number of boys and girls are 100 and 98 respectively. In class 6 the female students have outnumbered the mail students. The enrolled female students in this class are 130 and male students are 120.
Ans: The graph shows the enrollment of students at school from class 6 to class 10. It shows the gradual increase of the enrollment of girls which is undoubtedly a positive change because total development of the country is not possible keeping the women aloof from education. In class 10 boys and girls students are 75 and 35 respectively which mean boys are more than double of the girls. In class 9 the scenario is almost the same. In class 9 the number of boys and girls are 80 and 40 respectively. The number of girls in class 8. In this class the number is 90 respectively. But we see a different scenario in classes six and seven. In class 7 the number of boys and girls is almost the same. The number of boys and girls are 100 and 98 respectively. In class 6 the female students have outnumbered the mail students. The enrolled female students in this class are 130 and male students are 120.


Post a Comment